This chapter describes several tools that you can use to monitor system performance. The tools are divided into two general categories: system monitoring tools and nonuniform memory access (NUMA) tools.
System monitoring tools include the hwinfo (1), topology(1), top(1) commands and the Performance Co-Pilot pmchart(1) commmand and other operating system commands such as the vmstat(1) , iostat(1) command and the sar(1) commands that can help you determine where system resources are being spent.
The gtopology(1) command displays a 3D scene of the system interconnect using the output from the topology(1) command.
You can use system utilities to better understand the usage and limits of your system. These utilities allow you to observe both overall system performance and single-performance execution characteristics. This section covers the following topics:
This section descibes hardware inventory and usage commands and covers the following topics:
The hwinfo (8) command is used to probe for the hardware present in the system. It can be used to generate a system overview log which can be later used for support. To see the version installed on your system, perform the following command:
% rpm -qf /usr/sbin/hwinfo hwinfo-12.55-0.3 |
For more information, see the hwinfo(8) man page.
The topology(1) command provides topology information about your system.
Applications programmers can use the topology command to help optimize execution layout for their applications. For more information, see the topology(1) man page.
Output from the topology command is similar to the following: (Note that the following output has been abbreviated.)
uv44-sys:~ # topology
Serial number: UV-00000044
Partition number: 0
4 Blades
64 CPUs
125.97 Gb Memory Total

Blade         ID       asic  NASID         Memory
-------------------------------------------------
    0 r001i01b00  UVHub 2.0      0    16757488 kB
    1 r001i01b01  UVHub 2.0      2    16777216 kB
    2 r001i01b02  UVHub 2.0      4    16777216 kB
    3 r001i01b03  UVHub 2.0      6    16760832 kB

CPU      Blade PhysID CoreID APIC-ID Family Model Speed L1(KiB) L2(KiB) L3(KiB)
-------------------------------------------------------------------------------
  0 r001i01b00     00     00       0      6    46  1866 32d/32i     256   18432
  1 r001i01b00     00     03       6      6    46  1866 32d/32i     256   18432
  2 r001i01b00     00     08      16      6    46  1866 32d/32i     256   18432
  3 r001i01b00     00     11      22      6    46  1866 32d/32i     256   18432
  4 r001i01b00     01     00      32      6    46  1866 32d/32i     256   18432
  5 r001i01b00     01     03      38      6    46  1866 32d/32i     256   18432
  6 r001i01b00     01     08      48      6    46  1866 32d/32i     256   18432
  7 r001i01b00     01     11      54      6    46  1866 32d/32i     256   18432
  8 r001i01b01     02     00      64      6    46  1866 32d/32i     256   18432
  9 r001i01b01     02     03      70      6    46  1866 32d/32i     256   18432
 10 r001i01b01     02     08      80      6    46  1866 32d/32i     256   18432
 11 r001i01b01     02     11      86      6    46  1866 32d/32i     256   18432
 12 r001i01b01     03     00      96      6    46  1866 32d/32i     256   18432
 13 r001i01b01     03     03     102      6    46  1866 32d/32i     256   18432
 14 r001i01b01     03     08     112      6    46  1866 32d/32i     256   18432
 15 r001i01b01     03     11     118      6    46  1866 32d/32i     256   18432
 16 r001i01b02     04     00     128      6    46  1866 32d/32i     256   18432
                                       ...
 62 r001i01b03     07     08     241      6    46  1866 32d/32i     256   18432
 63 r001i01b03     07     11     247      6    46  1866 32d/32i     256   18432
|
The gtopology(1) command is included as part of the sgi-pcp package of the SGI Accelerate, part of SGI Performance Suite software. It displays a 3D scene of the system interconnect using the output from the topology(1) command. See the man page for more details.
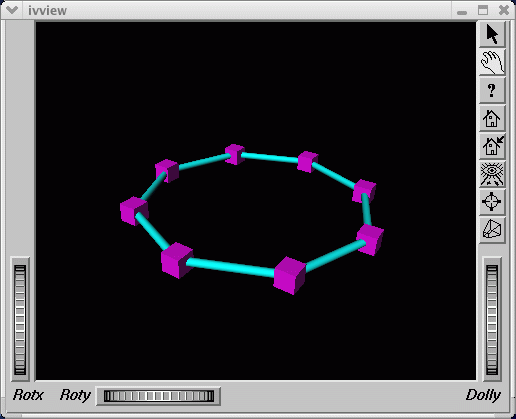
Figure 4-1, shows the ring topology (the eight nodes are shown in pink, the NUMAlink connections in cyan) of an Altix system with 16 CPUs.
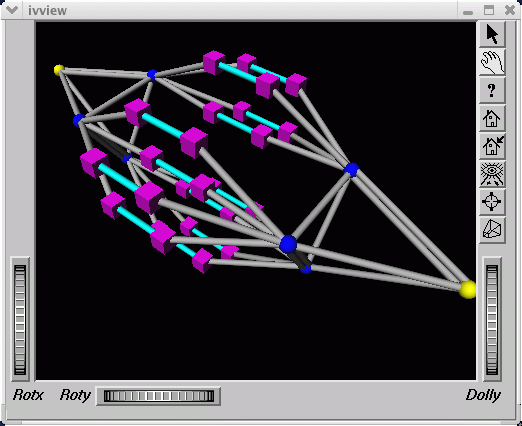
Figure 4-2, shows the fat-tree topology of an Altix system with 32 CPUs. Again, nodes are the pink cubes. Routers are shown as blue spheres (if all ports are used) otherwise, yellow.
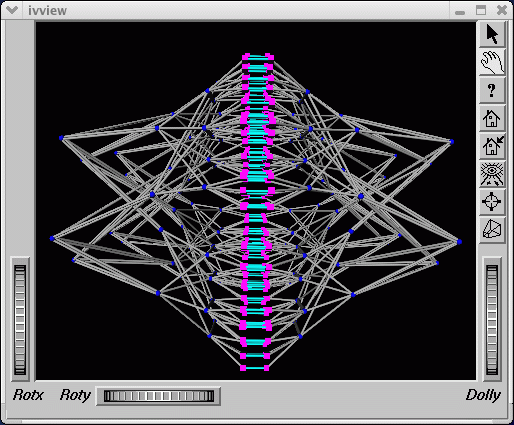
Figure 4-3, shows an Altix ystem with 512 CPUs. The dual planes of the fat-tree topology are clearly visible.
This section describes Performance Co-Pilot monitoring tools and covers the following topics:
The hubstats(1) command is a command line tool for monitoring NUMAlink traffic, directory cache operations and global reference unit (GRU) traffic statistics on SGI Altix UV systems. It will not work on any other platform.
| Note: Cacheline traffic is currently not working on SGI Altix UV 100 and SGI Altix UV 1000 series systems. |
For more information, see the hubstats(1) man page.
The linkstat-uv(1) command is a command-line tool for monitoring NUMAlink traffic and error rates on SGI Altix UV systems. It will not work on any other platform.This tool shows packets and Mbytes sent/received on each NUMAlink in the system, as well as error rates. It is useful as a performance monitoring tool, as well as, a tool for helping you to diagnose and identify faulty hardware. For more information, see the linkstat-uv(1) man page.
In addition to the Altix specific tools described above, the pcp and pcp-sgi packages also provide numerous other performance monitoring tools, both graphical and text-based. It is important to remember that all of the performance metrics displayed by any of the tools described in this chapter can also be monitored with other tools such as pmchart(1), pmval(1), pminfo(1) and others. Additionally, the pmlogger(1) command can be used to capture Performance Co-Pilot archives, which can then be "replayed" during a retrospective performance analysis.
A very brief description of other Performance Co-Pilot monitoring tools follows. See the associated man page for each tool for more details.
pmchart(1) -- graphical stripchart tool, chiefly used for investigative performance analysis.
pmgsys(1) -- graphical tool showing miniature CPU, Disk, Network, LoadAvg and memory/swap in a miniature display, for example, useful for permanent residence on your desktop for the servers you care about.
pmgcluster(1) -- pmgsys , but for multiple hosts and thus useful for monitoring a cluster of hosts or servers.
clustervis(1) -- 3D display showing per-CPU and per-Network performance for multiple hosts.
nfsvis(1) -- 3D display showing NFS client/server traffic, grouped by NFS operation type
nodevis(1) -- 3D display showing per-node CPU and memory usage.
webvis(1) -- 3D display showing per-httpd traffic.
dkvis(1) - 3D display showing per-disk traffic, grouped by controller.
diskstat(1) -- command line tool for monitoring disk traffic.
topsys(1) -- command line, curses-based tool, for monitoring processes making a large numbers of system calls or spending a large percentage of their execution time in system mode using assorted system time measures.
pmgxvm(1) -- miniature graphical display showing XVM volume topology and performance statistics.
osvis(1) -- 3D display showing assorted kernel and system statistics.
mpivis(1) -- 3D display for monitoring multithreaded MPI applications.
pmdumptext(1) -- command line tool for monitoring multiple performance metrics with a highly configurable output format. Therefore, it is a useful tools for scripted monitoring tasks.
pmval(1) -- command line tool, similar to pmdumptext(1), but less flexible.
pminfo(1) -- command line tool, useful for printing raw performance metric values and associated help text.
pmprobe(1) -- command line tool useful for scripted monitoring tasks.
pmie(1) -- a performance monitoring inference engine. This is a command line tool with an extraordinarily powerful underlying language. It can also be used as a system service for monitoring and reporting on all sorts of performance issues of interest.
pmieconf(1) -- command line tool for creating and customizing "canned" pmie(1) configurations.
pmlogger(1) -- command line tool for capturing Performance Co-Pilot performance metrics archives for replay with other tools.
pmlogger_daily(1) and pmlogger_check (1) -- cron driven infrastructure for automated logging with pmlogger(1).
pmcd(1) -- the Performance Co-Pilot metrics collector daemon
PCPIntro(1) -- introduction to Performance Co-Pilot monitoring tools, generic command line usage and environment variables
PMAPI(3) -- introduction to the Performance Co-Pilot API libraries for developing new performance monitoring tools
PMDA(3) -- introduction to the Performance Co-Pilot Metrics Domain Agent API, for developing new Performance Co-Pilot agents
Several commands can be used to determine user load, system usage, and active processes.
To determine the system load, use the uptime (1) command, as follows:
uv44-sys:~ # uptime 3:48pm up 2:50, 5 users, load average: 0.12, 0.25, 0.40 |
The output displays time of day, time since the last reboot, number of users on the system, and the average number of processes waiting to run.
To determine who is using the system and for what purpose, use the w(1) command, as follows:
uv44-sys:~ # w 15:47:48 up 2:49, 5 users, load average: 0.04, 0.27, 0.42 USER TTY LOGIN@ IDLE JCPU PCPU WHAT root pts/0 13:10 1:41m 0.07s 0.07s -bash root pts/2 13:31 0.00s 0.14s 0.02s w boetcher pts/4 14:30 2:13 0.73s 0.73s -csh root pts/5 14:32 1:14m 0.04s 0.04s -bash root pts/6 15:09 31:25 0.08s 0.08s -bash |
The output from this command shows who is on the system, the duration of user sessions, processor usage by user, and currently executing user commands.
To determine active processes, use the ps(1) command, which displays a snapshot of the process table. The ps -A command selects all the processes currently running on a system as follows:
[user@profit user]# ps -A
  PID TTY          TIME CMD
    1 ?        00:00:06 init
    2 ?        00:00:00 migration/0
    3 ?        00:00:00 migration/1
    4 ?        00:00:00 migration/2
    5 ?        00:00:00 migration/3
    6 ?        00:00:00 migration/4
                    ...
 1086 ?        00:00:00 sshd
 1120 ?        00:00:00 xinetd
 1138 ?        00:00:05 ntpd
 1171 ?        00:00:00 arrayd
 1363 ?        00:00:01 amd
 1420 ?        00:00:00 crond
 1490 ?        00:00:00 xfs
 1505 ?        00:00:00 sesdaemon
 1535 ?        00:00:01 sesdaemon
 1536 ?        00:00:00 sesdaemon
 1538 ?        00:00:00 sesdaemon
|
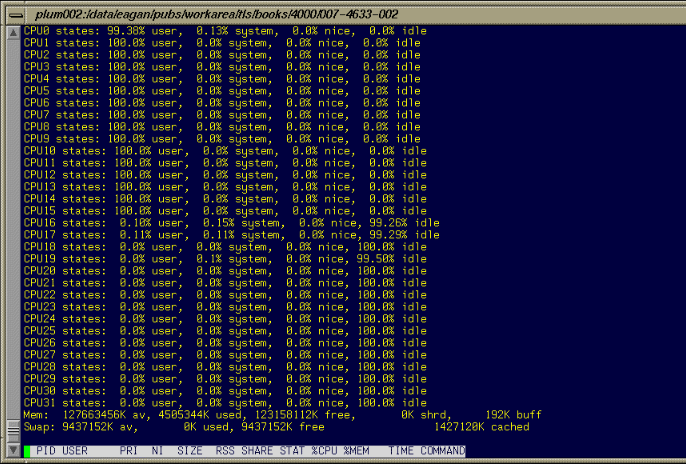
To monitor running processes, use the top (1) command. This command displays a sorted list of top CPU utilization processes as shown in Figure 4-4.
The vmstat(1) command reports virtual memory statistics. It reports information about processes, memory, paging, block IO, traps, and CPU activity. For more information, see the vmstat(1) man page.
uv44-sys:~ # vmstat procs -----------memory---------- ---swap-- -----io---- -system-- -----cpu------ r b swpd free buff cache si so bi bo in cs us sy id wa st 0 0 0 130301028 79868 1287576 0 0 1 0 8 7 0 0 100 0 0 |
The first report produced gives averages since the last reboot. Additional reports give information on a sampling period of length delay. The process and memory reports are instantaneous in either case.
The iostat(1) command is used for monitoring system input/output device loading by observing the time the devices are active in relation to their average transfer rates. The iostat command generates reports that can be used to change system configuration to better balance the input/output load between physical disks. For more information, see the iostat(1) man page.
uv44-sys:~ # iostat
Linux 2.6.32.13-0.4.1.1559.0.PTF-default (uv44-sys) 10/18/2010  _x86_64_

avg-cpu:  %user   %nice %system %iowait  %steal   %idle
           0.18    0.00    0.04    0.02    0.00   99.77

Device:            tps   Blk_read/s   Blk_wrtn/s   Blk_read   Blk_wrtn
sda               3.02        72.80        16.28     722432     161576
sdb               0.01         0.34         0.00       3419          0
|
The nmon command is a performance monitor for Linux available at http://nmon.sourceforge.net/pmwiki.php.
iotop is a program with a top-like user interface that shows which processes are performing the most I/O on a Linux system and is available at http://freshmeat.net/projects/iotop.
The sar(1) command writes to standard output the contents of selected cumulative activity counters in the operating system. The accounting system, based on the values in the count and interval parameters, writes information the specified number of times spaced at the specified intervals in seconds. For more information, see the sar(1) man page.
uv44-sys:~ # sar Linux 2.6.32.13-0.4.1.1559.0.PTF-default (uv44-sys) 10/18/2010 _x86_64_ 12:58:47 PM LINUX RESTART 01:00:01 PM CPU %user %nice %system %iowait %steal %idle 01:10:01 PM all 0.00 0.00 0.01 0.01 0.00 99.99 01:20:01 PM all 0.00 0.00 0.00 0.00 0.00 99.99 01:30:01 PM all 0.00 0.00 0.01 0.00 0.00 99.99 01:40:01 PM all 0.02 0.00 0.01 0.01 0.00 99.96 01:50:01 PM all 0.03 0.00 0.01 0.02 0.00 99.94 02:00:01 PM all 0.12 0.00 0.01 0.01 0.00 99.86 02:10:01 PM all 0.01 0.00 0.01 0.00 0.00 99.98 02:20:01 PM all 0.76 0.00 0.04 0.00 0.00 99.20 02:30:01 PM all 0.28 0.00 0.01 0.00 0.00 99.71 02:40:01 PM all 0.27 0.00 0.14 0.05 0.00 99.54 02:50:01 PM all 0.00 0.00 0.01 0.00 0.00 99.99 03:00:01 PM all 0.00 0.00 0.01 0.03 0.00 99.96 03:10:01 PM all 0.20 0.00 0.03 0.01 0.00 99.76 03:20:01 PM all 0.02 0.00 0.01 0.01 0.00 99.96 03:30:01 PM all 0.15 0.00 0.08 0.00 0.00 99.77 03:40:01 PM all 1.03 0.00 0.10 0.08 0.00 98.79 Average: all 0.18 0.00 0.03 0.02 0.00 99.77 |
nodeinfo(1) is a tool for monitoring per-node NUMA memory statistics on SGI Altix and Altix UV systems. The nodeinfo tool reads /sys/devices/system/node/*/meminfo and /sys/devices/system/node/*/numastat on the local system to gather NUMA memory statistics.
Sample memory statistic from the nodeinfo (1) command are, as follows:
uv44-sys:~ # nodeinfo
Memory Statistics  Tue Oct 26 12:01:58 2010
uv44-sys
      ------------------------- Per Node KB --------------------------------  ------ Preferred Alloc -------  -- Loc/Rem ---
node       Total        Free        Used       Dirty        Anon        Slab     hit    miss foreign interlv   local  remote
   0    16757488    16277084      480404          52       34284       36288   20724       0       0       0   20720       4
   1    16777216    16433988      343228          68        6772       17708    4477       0       0       0    3381    1096
   2    16777216    16438568      338648          76        6908       12620    1804       0       0       0     709    1095
   3    16760832    16429844      330988          56        2820       16836    1802       0       0       0     708    1094
   4    16777216    16444408      332808          88       10124       13588    1517       0       0       0     417    1100
   5    16760832    16430300      330532          72        1956       17304    4546       0       0       0    3453    1093
   6    16777216    16430788      346428          36        3236       15292    3961       0       0       0    2864    1097
   7    16760832    16435532      325300          44        1220       14800    3971       0       0       0    2877    1094
 TOT   134148848   131320512     2828336         492       67320      144436   42802       0       0       0   35129    7673
Press "h" for help |
From an interactive nodeinfo session, enter h for a help statement:
Display memory statistics by node.
        q   quit
        +   Increase starting node number. Used only if more nodes than will
            fit in the current window.
        -   Decrease starting node number. Used only if more nodes than will
            fit in the current window.
        b   Start output with node 0.
        e   Show highest node number.
        k   show sizes in KB.
        m   show sizes in MB.
        p   show sizes in pages.
        t   Change refresh rate.
        A   Show/Hide memory policy stats.
        H   Show/Hide hugepage info.
        L   Show/Hide LRU Queue stats.

Field definitions:
        hit - page was allocated on the preferred node
        miss - preferred node was full. Allocation occurred on THIS node
               by a process running on another node that was full

        foreign - Preferred node was full. Had to allocate somewhere
                  else.

        interlv - allocation was for interleaved policy

        local - page allocated on THIS node by a process running on THIS node
        remote - page allocated on THIS node by a process running on ANOTHER node


(press any key to exit from help screen) |
For more information on using nodeinfo to view memory consumption on the nodes assigned to your job, see “Other ccNUMA Performance Issues” in Chapter 6.


