 Secrets of the Sampling View
  Secrets of the Sampling View
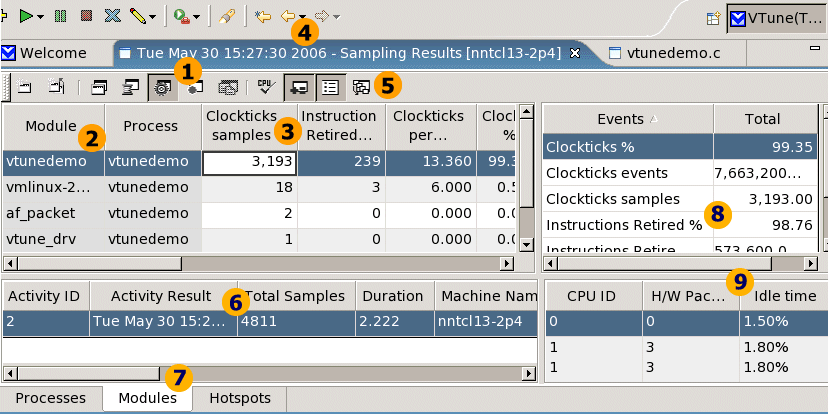
 The following graphic shows the Module view of a sample project and provides a short explanation of several of the view elements:

|
|
Use the toolbar to switch between Process, Thread, Module, Function, and Source views. |
|
This line shows general information for the collected sampling data. |
|
|
This column displays modules for which data was collected. |
|
Use the tabs at the bottom of the view to switch between the views showing the results of this Activity run. |
|
|
Click the column header to sort the modules by ascending/descending order to focus on most active modules. |
|
The Selection Summary shows total values of events, samples, and percentage of samples collected for the module selected in the table on the left. |
|
|
Use the Next and Previous buttons to navigate between the result views. |
|
This is the Idle time view that shows the percentage of time each logical processor was idle. |
|
|
Click Enable/Disable per Thread View to view the number of events per three heaviest threads. |
|
|

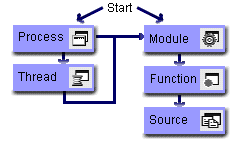
The process of drilling down is selecting an item from a specific view and exploring the next level of detail. For example:
Double-click a process in the Process view to view the threads that run within that process.
Double-click a thread in the Thread view to see the modules in that thread.
Each time you drill down, you filter out data, keeping only the information on the process, thread, or module that you double clicked.
Depending on the type of code you are analyzing, you may want to start with the Process view or Module view.
| Process view |
Start with this view for typical applications or libraries loaded by a single application. Within this view, select the application process and press the Module view button to display only those modules that were loaded by the application such as application and library binaries. Following this path removes system noise. |
|
Start with this view for kernel modules and libraries shared by multiple applications. This view displays all modules loaded by the OS, regardless of which process caused the OS to load the module. |
 note
noteIf you run the sampling Activity to collect the Clockticks event, the Summary view opens by default. To access the Module view, click the View All Modules link in the Summary view. To access the Process view, click the All Processes link.
By default, when launching the Activity from the sampling wizard, the VTune(TM) Performance Analyzer samples Clockticks event and the Instructions Retired event.
The Clockticks event, also known as Cycles, counts the basic unit of time recognized by each physical processor package in the Intel NetBurst(R) microarchitecture family of processors. It forms a fundamental basis for measuring how long a program takes to execute, and is as part of efficiency ratios like cycles per instruction (CPI).
The Instructions Retired event indicates the number of instructions that executed completely. This does not include partially processed instructions that were executed due to branch mispredictions. Instructions retired are a key component in many event ratios.
Performance analysts at Intel have identified and grouped key events that serve as a good starting point for performance tuning. For more details, see the Selecting Events for EBS topic.