 About Activity Results
 About Activity Results
Activity results are the result of running an Activity. Running an Activity runs the data collector, which in turn collects performance data and generates Activity results. The Activity results are saved as nodes in the Tuning Browser and can be viewed later without re-running the Activity.
Activity results enable you to compare performance before and after modifying an application. For example, you can generate Activity results for one version of the executable file, revise the code, generate a new executable file, run the same Activity, and generate new Activity results. You can now compare the two sets of Activity results to see if the performance has changed.
Select the Activity result in the Tuning Browser.
Double-click to open a related data view.
The data view appears and displays the data. From the data view, you can drill down to more details or to a specific hotspot or section of your code, if you are tuning a specific application.
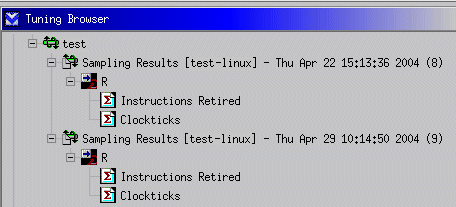
An Activity with one collector and its Activity results appears in the Tuning Browser as follows:
Activity name
collector Results [machine name] - date and time1 (#n)
sub results
collector Results [machine name] - date and time2 (#m)
Where:
Item |
Description |
|
Activity name |
The name of the Activity. |
|
collector |
The name of the collector. If the Activity has more than one collector, each collector generates a separate Activity result. |
|
machine name |
The name of the machine on which the data was collected. |
|
date and time |
The date and time at which the Activity result was generated. |
|
#n and #m |
A unique value that distinguishes one Activity Result from another. This value may be used in data views. |
This following example shows all these elements in the Tuning Browser:

Double-click one Activity result to open its related data view.
Drag another Activity result onto the open data view.
Repeat for any additional Activity Result you would like to compare.
Drag and drop column headers to enable comparison between two related columns,
or, right-click the columns section and select Column Layout. Use the arrows to rearrange the columns.
 Note
NoteSome data collectors may not support comparison of Activity results side by side.
vtl show [-a | -all]
The show command without any options displays all Activities in the project and top-level Activity results.
Command-line example:
a1__Activity1
r1__Sampling Results - Fri Oct 25 17:48:45 2002
a2__Activity2
r1__Sampling Results - Fri Oct 25 18:10:10 2002
r2__Sampling Results - Fri Oct 25 18:15:06 2002
To view the entire content of the project tree, use -all (or -a) option. The Activity and its Activity results will be displayed in the following format:
a1__Activity1
r1__activity result 1
r2___Mini ar result 1
r3___Mini ar result 2
a2__Activity2
r1__activity result 1
This will show both the short and full name of the Activities and Activity results. For sampling data collection, for example, this invocation will show all Activity runs for each event.