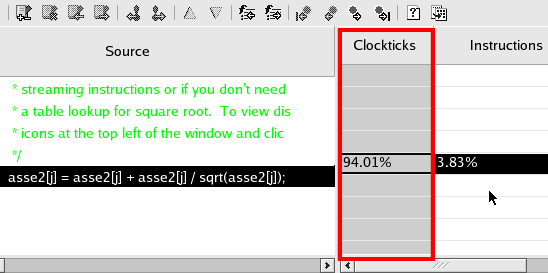
Select the column with an event or event ratio you are
interested in from the dynamic pane located to the right of the Source
pane. To select the column, click any cell in this column.
The column is highlighted in gray:

Locate and view the hotspots for this particular event/event ratio by using the following source view toolbar buttons:
Button |
Name |
Purpose |
|
Go to Largest Hotspot |
Goes to the code line with the highest value for the selected event/event ratio. | |
|
Go to Previous Hotspot |
Goes to the previous (in decreasing order) hotspot for the selected event/event ratio. | |
|
Go to Next Hotspot |
Goes to the next (in decreasing order) hotspot for the selected event/event ratio. | |
|
Go to Smallest Hotspot |
Goes to the smallest non-zero hotspot for the selected event/event ratio. |
 Tip
Tip