 About Function Summary ViewAbout Function Summary View
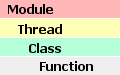
The upper section of the call graph window displays the function information in a table format. The rows in the function summary display functions with different background colors according to the hierarchical position. The default view shows the first four types of data as follows:
To view the function summary information from the command line, type: vtl view <ActivityName::ActivityResultName> -functions.
Command-line example:
>vtl view a1::r2 -functions
where a1 - Activity name, r2 - Activity result name.
The function summary view provides the following columns:
Column |
Description |
|---|---|
|
Module name (vtl only) |
Module name or the Java* package to which the function belongs. |
|
Thread |
Thread to which the function belongs. |
|
Function |
Name of the function. |
|
Class |
Class to which the function belongs. |
|
Calls |
Number of times the function was called by all callers. |
|
Self Time |
Time (microseconds) spent in the function itself. |
|
Total Time |
Time (microseconds) spent in the function and in all the callees it called. |
|
Self Wait Time |
Time (microseconds) spent inside the function while its thread was suspended. |
|
Total Wait Time |
Time (microseconds) spent in a function and its children while its thread was suspended. |
|
Callers |
Number of caller functions that called the function. |
|
Callees |
Number of callee functions the function called. |
|
Caller Function |
Name of the parent function. |
|
Callee Function |
Name of the child function. |
|
Address |
Address of the selected row item. |
|
External Name |
Function name followed by a string of characters that the compiler and linker use to retain type information. These characters are necessary to resolve ambiguities that may arise in C++ from having more than one function with the same name. |
|
Full Name |
Definition of the function, including the name of the function along with all its parameters. |
|
Contribution |
Self time of a function as a percentage of its Total time. |
|
CallSite |
The nearest location of the function's symbolic ID + the offset from the start of the function. |
|
Module Path |
Location of the module. |
|
Source File |
Name of source file to which the function belongs. |
|
% in function |
Ratio displaying how much time was spent in the function itself. You can calculate the ratio using the following formula: (Call graph:Self Time/Call graph:Total Time)* 100 |
|
Average Self time per call |
Ratio showing the average distribution of self time in milliseconds. You can calculate the ratio using the following formula: Call graph:Self Time/Call graph:Calls |
|
Average Total time per call |
Ratio showing the average distribution of self time in milliseconds. You can calculate the ratio using the following formula: Call graph:Total Time/Call
graph:Calls |
|
Display Name |
Name of the function. |
|
Process (vtl only) |
Name of the process to which the function belongs. |
|
Mangled Name (vtl only) |
Encoded C++ name of the function used by the C linkers. |
 tip
tipFor better viewing and filtering, you can redirect the function view output into .csv file and view it with any spreadsheet application or create your own script and run it on collected data to display the required information in the required format.
To view call information for a specific function, use this format:
vtl
view <ActivityName::ActivityResultName> -calls -focus-func <function_name>.
Command-line example:
>vtl view a3::r1 -calls -focus-func main
The output is:
VTune(TM) Performance Analyzer 9.0 for Linux OS*
Copyright (C) 2000-2008 Intel Corporation. All rights reserved.
[NAME(1)]; [DISPLAY_NAME(2)]; [PROCESS(3)]
main; main; /home/vtune/gsexaples/gsexample2a
Caller functions:
[NAME(1)]; [CONTRIBUTION(2)]; [#_CALLS(3)]; [TOTAL_TIME(4)]; [WAIT_TIME(5)]; [MODULE(6)]; [CLASS(7)]; [DISPLAY_NAME(8)]; [THREAD(9)]; [PID(10)]
__libc_start_main; 100.0%; 1; 7988500; 0; /lib/tls/libc.so.6; ; __libc_start_main; Thread_0(B7F926C0); 18988
Callee functions:
[NAME(1)]; [CONTRIBUTION(2)]; [#_CALLS(3)]; [TOTAL_TIME(4)]; [WAIT_TIME(5)]; [MODULE(6)]; [CLASS(7)]; [DISPLAY_NAME(8)]; [THREAD(9)]; [PID(10)]
__difftime; 0.0%; 5603; 495; 0; /lib/tls/libc.so.6; ; __difftime; Thread_0(B7F926C0); 18988
GenDenormals; 0.8%; 5602; 61668; 0; /home/vtune/gsexaples/gsexample2a; ; GenDenormals; Thread_0(B7F926C0); 18988
ProcessFile; 99.0%; 5602; 7911945; 0; /home/vtune/gsexaples/gsexample2a; ; ProcessFile; Thread_0(B7F926C0); 18988
DoSomeWork; 0.0%; 1868; 3061; 0; /home/vtune/gsexaples/gsexample2a; ; DoSomeWork; Thread_0(B7F926C0); 18988
ctime; 0.0%; 2; 161; 0; /lib/tls/libc.so.6; ; ctime; Thread_0(B7F926C0); 18988
time; 0.1%; 5604; 7236; 0; /lib/tls/libc.so.6; ; time; Thread_0(B7F926C0); 18988
printf; 0.0%; 17; 1652; 0; /lib/tls/libc.so.6; ; printf; Thread_0(B7F926C0); 18988
noteThe VTune analyzer can display function names only if the symbol information is available in the executable. It does not support other symbol files, such as .map and .pdb.
Click the following buttons for more information about the call graph:
![]()